
San Francisco Real Estate
September 2020 Report
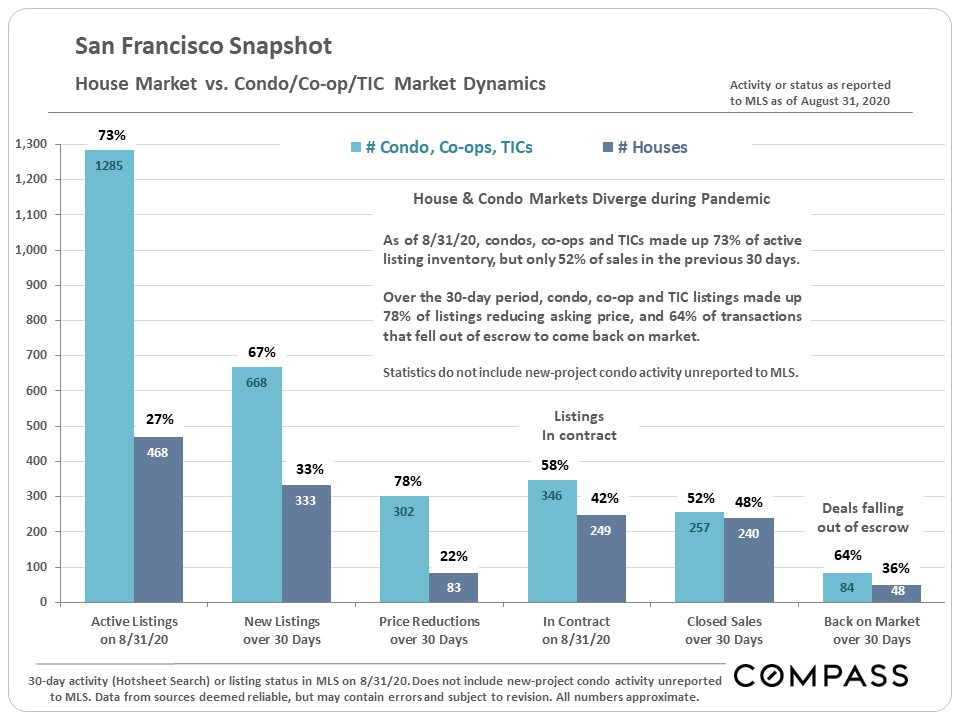
The table below compares Q3 statistics across 5 years. Since the dynamics of the SF house and condo markets have significantly diverged since the pandemic struck - the condo market has been weaker - we broke some of the 2020 stats out separately in the table, and then in some of the charts following.
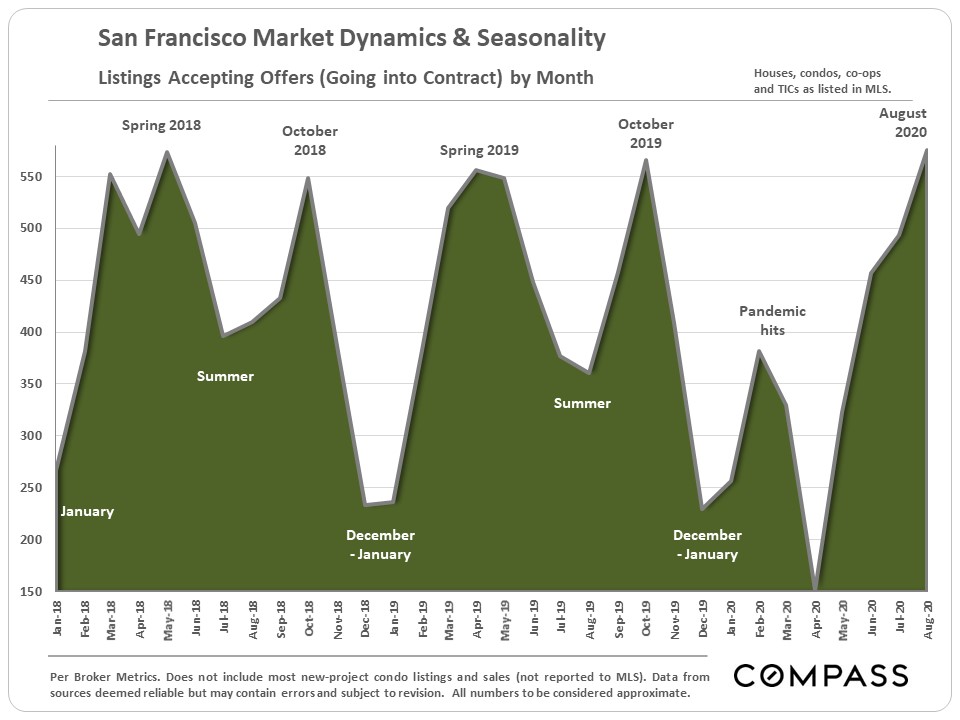
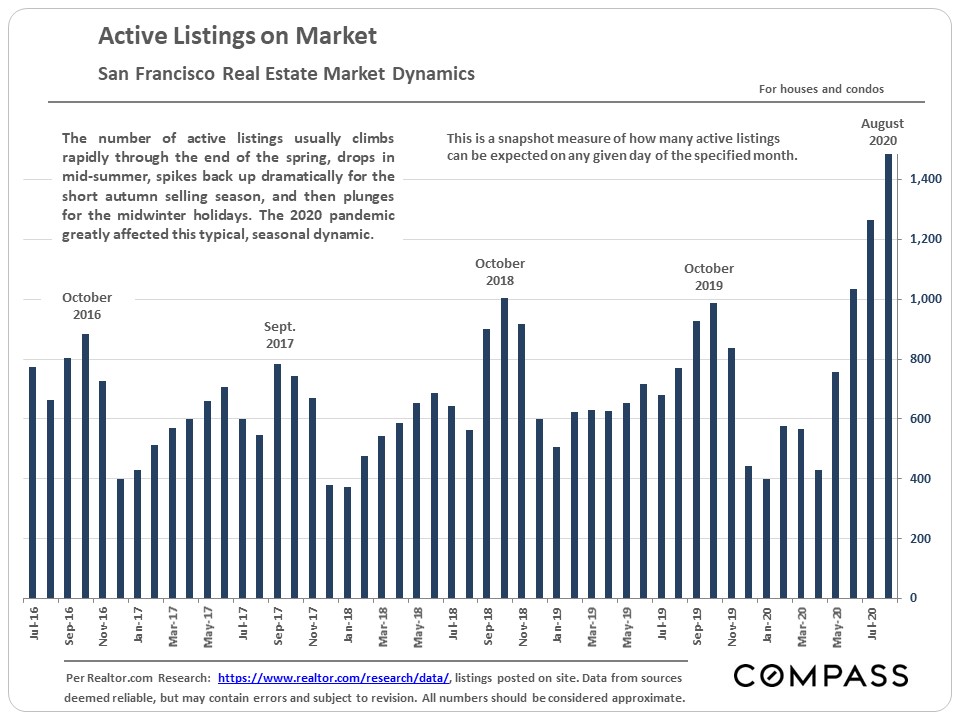
The number of active listings on the SF market has risen dramatically over the last few months, outpacing the increase in listings going into contract. However, there are significant differences between the house and condo markets, which are discussed later in the report.
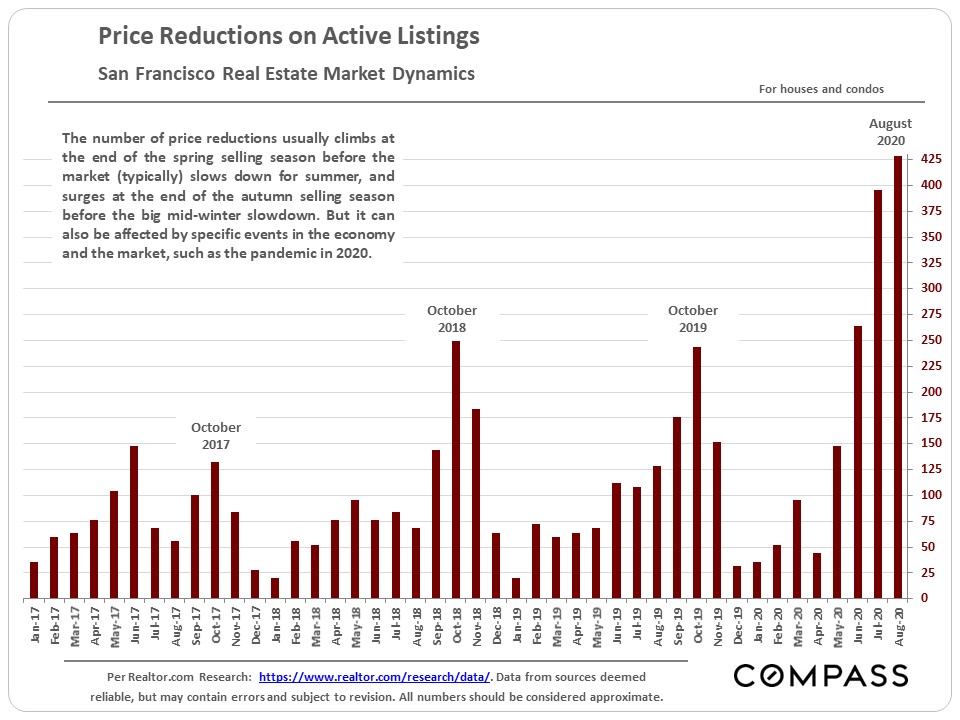
With the increase in inventory has come a big jump in the number of listings reducing the asking price. In some market segments, sellers are now competing for buyers, instead of buyers competing for listings.
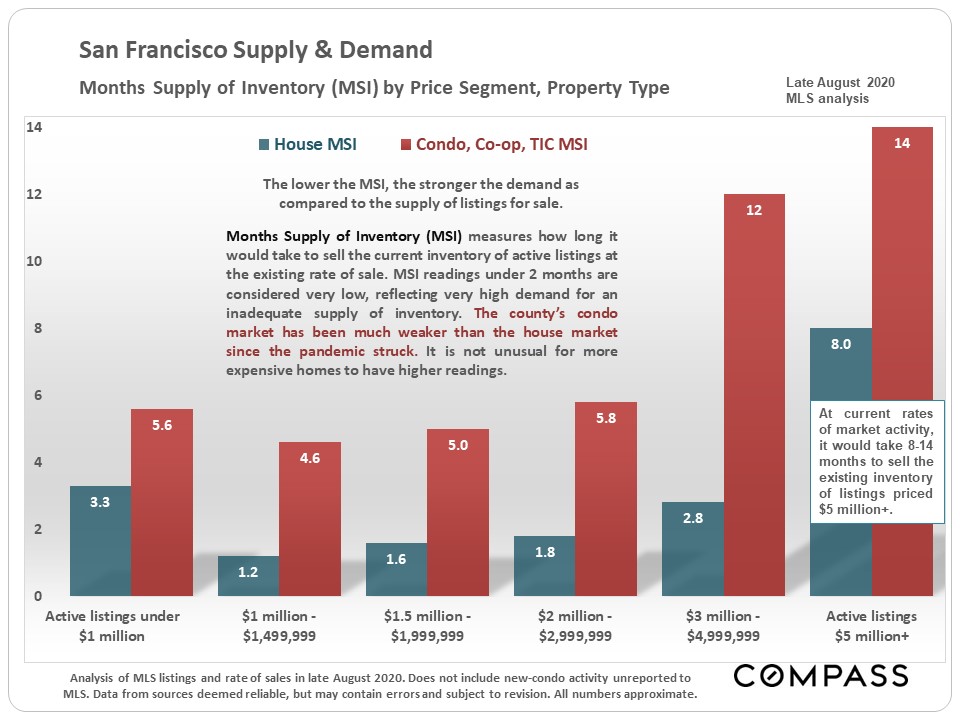
The next two charts illustrate how the house and condo markets have diverged since the pandemic hit. The condo market is much weaker, comparing the demand to supply. However, within the condo market, different neighborhoods are seeing varying dynamics, and hundreds of condos are still selling each month. More detail follows later in the report.
Regarding the next chart, the lower the Months Supply of Inventory (MSI), the stronger the demand as compared to the supply of listings for sale. Much of the SF house market (blue columns) remains firmly in "seller's market" territory, but the condo market's supply (red columns) is outpacing buyer demand, especially in the higher price segments.
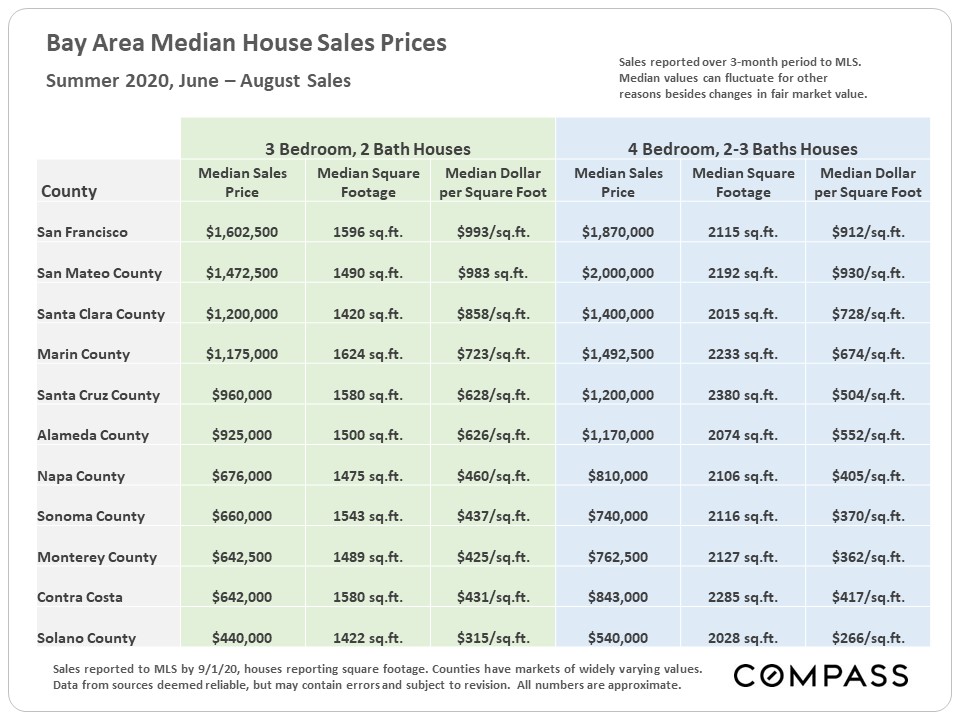
Below is a comparison of median house sales prices, sizes, and dollar per square foot values around the Bay Area this past summer.
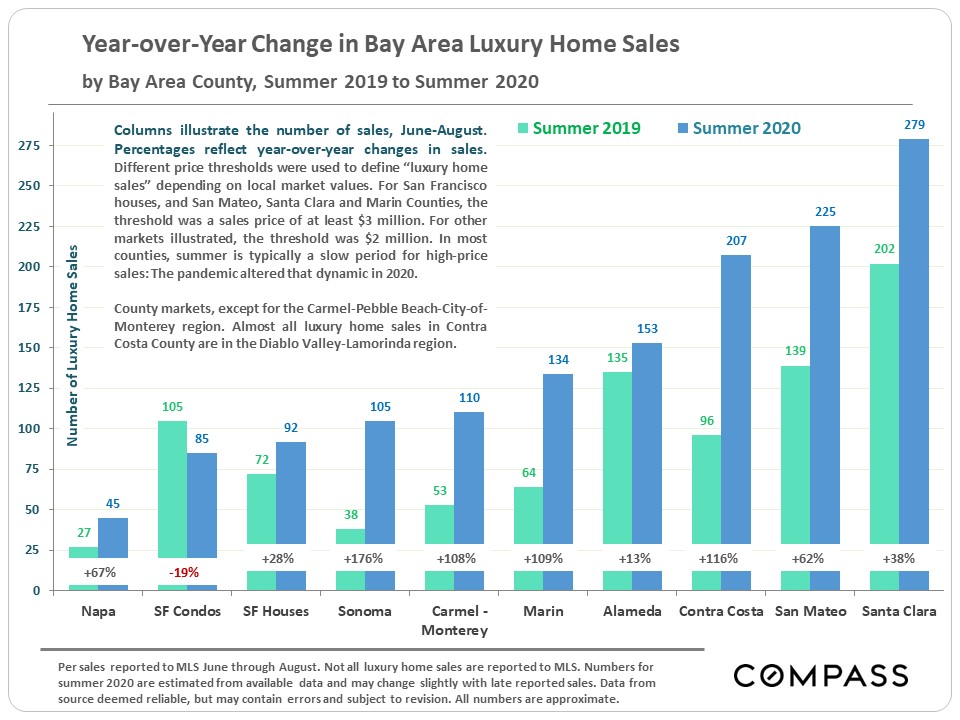
A review of year-over-year changes in the number of luxury home sales around the Bay Area this past summer. Some other counties have seen astounding increases. SF luxury house sales increased by a more modest percentage; SF luxury condo sales declined year over year.
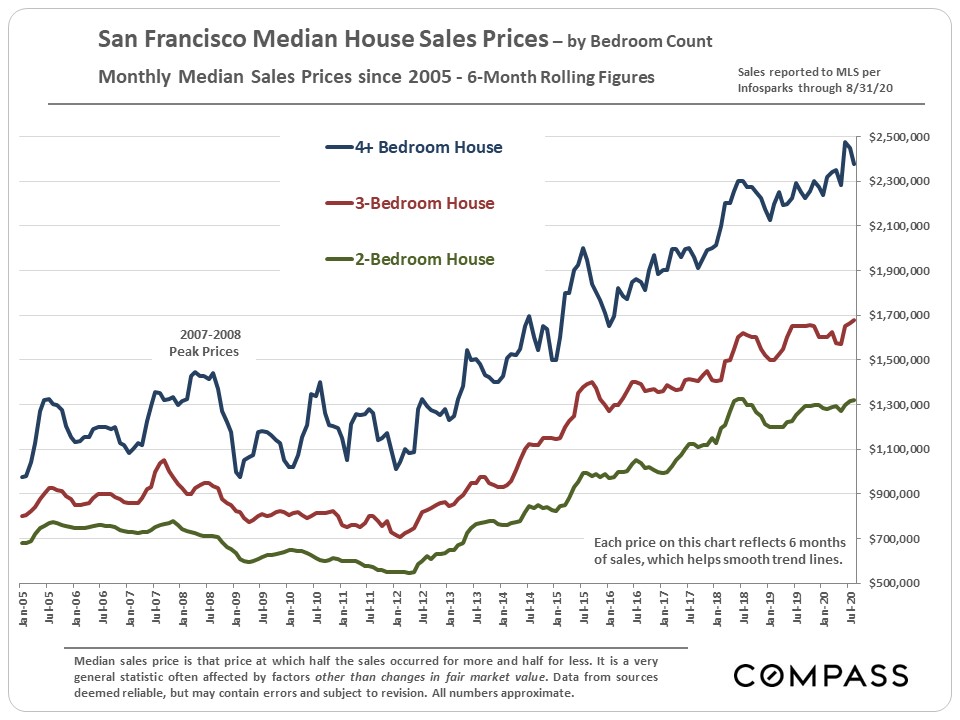
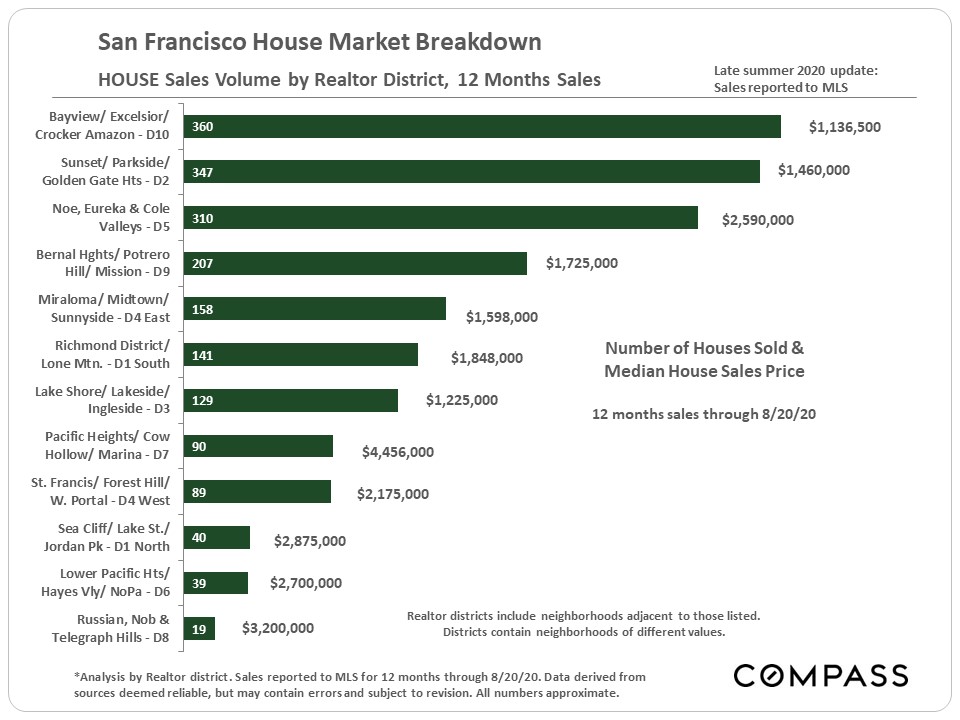
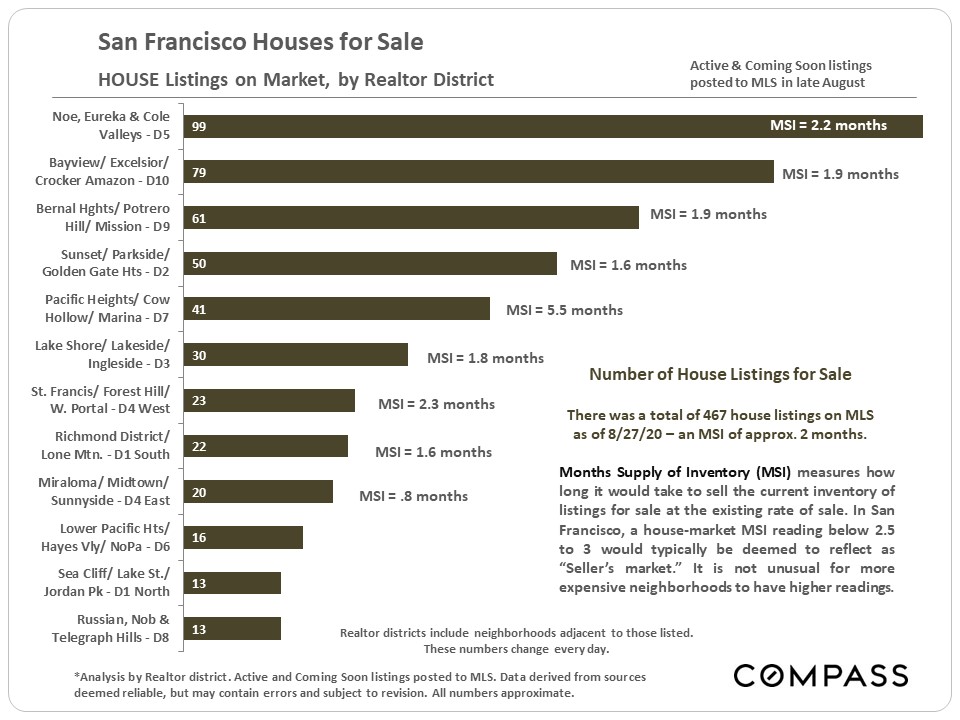
The following 3 charts illustrate aspects of the SF HOUSE market: Median house sales price trends by bedroom count; sales volumes and median sales prices by Realtor district; and the number of active house listings by Realtor district with an analysis of months supply of inventory.
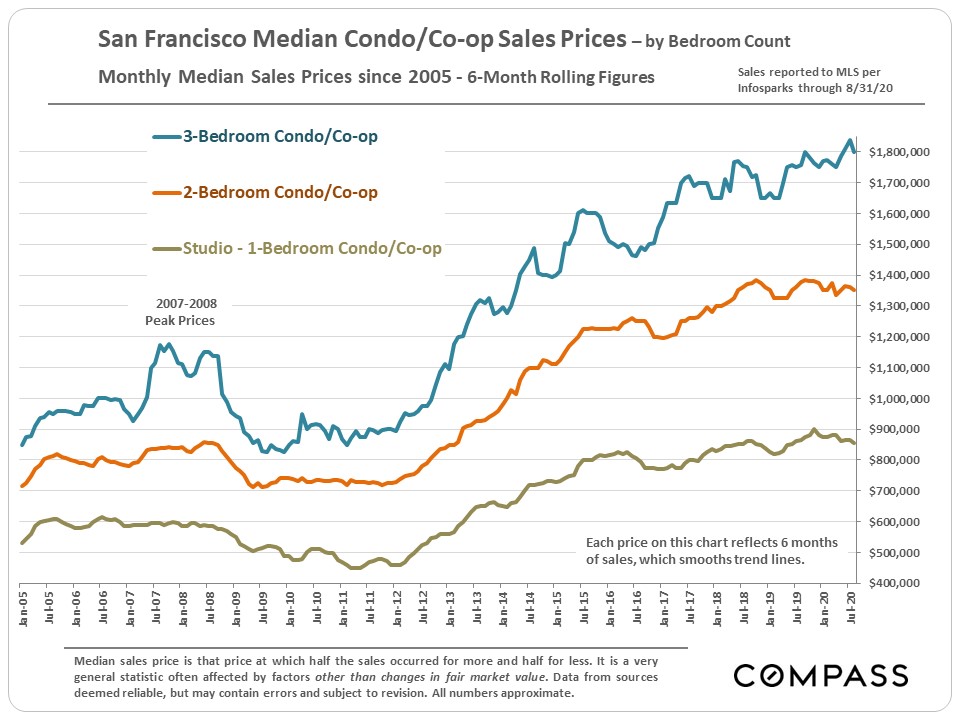
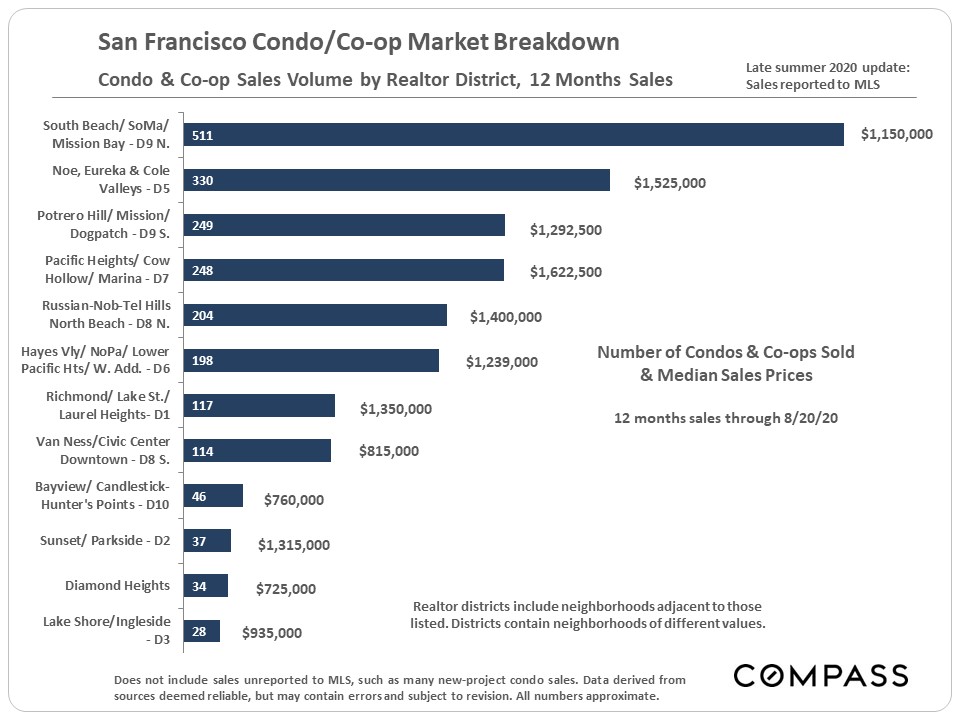
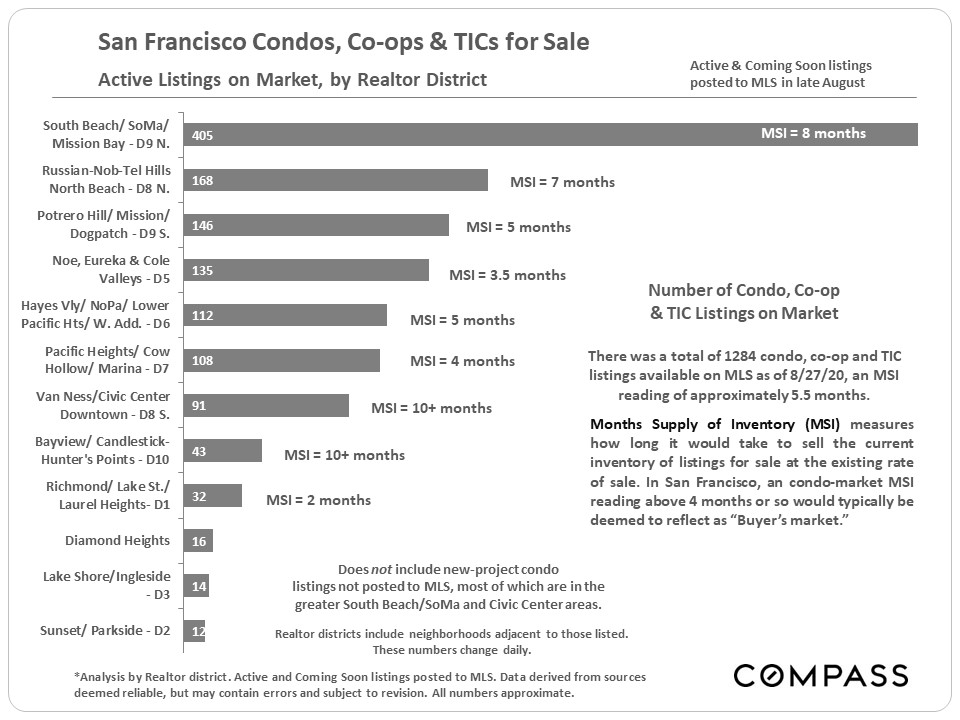
The following 3 charts illustrate aspects of the SF CONDO & CO-OP market: Median sales price trends by bedroom count; sales volumes and median sales prices by Realtor district; and the number of active listings by Realtor district with an analysis of months supply of inventory.
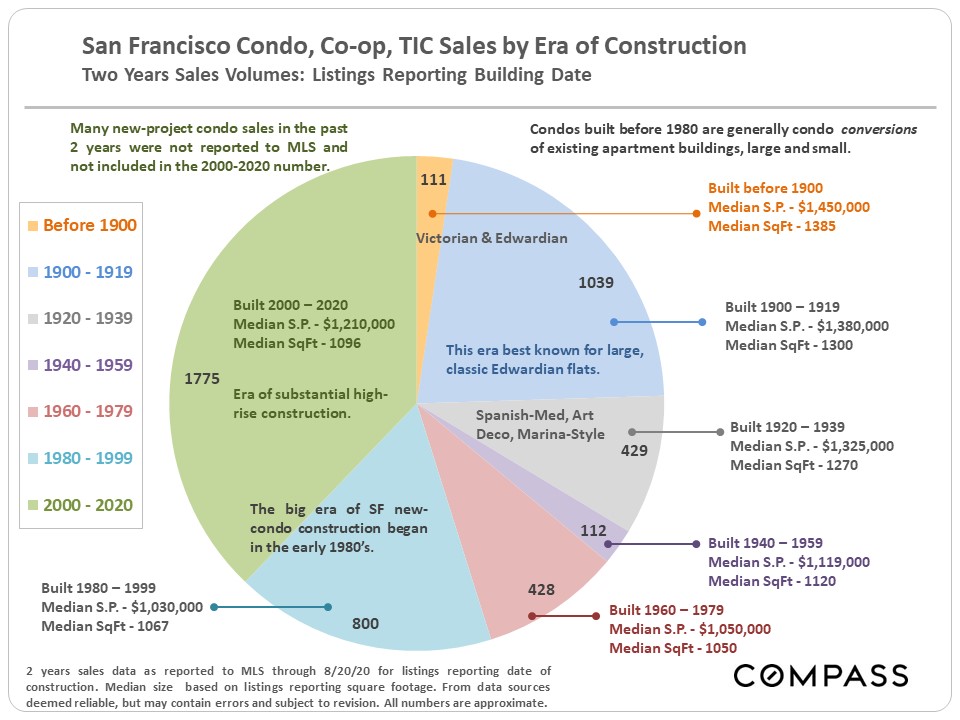
In last month's report, we looked at the era of construction for the city's houses. The chart below does the same for the SF condo, co-op, and TIC market.